Use heuristics for the middle of a distribution, not for the tails
From timeless aphorisms to common wisdom to first impressions, virtually every decision we make is to some degree informed by heuristics, also known as rules of thumb or approximate answers.
Most decisions are not the products of calculated analysis, but rather - in the words of Daniel Kahneman - outputs of System 1. They are rapid, unconscious and automatic. Perhaps counterintuitively, they are very often reliable.
It’s worth emphasizing: we wouldn’t use heuristics if they didn’t work. Heuristics work most of the time, despite being systematically exploitable some of the time. People need heuristics.
As an example, take your morning routine. You get out of bed, go to the bathroom, brush your teeth, change, eat breakfast, and so on. All of these routine decisions rely on heuristics. You are not evaluating whether or not you should do any of those things. What you are doing is relying on the heuristic, “what worked yesterday should work again today.” There is no calculation, no thoughtful consideration, no rational analysis here. These are all System 1 decisions, each relying on relevant and practical heuristics.
And clearly, for good reason. We don’t want to, nor need to, evaluate every decision we make. Heuristics work.
At the same time, we’re often cautioned against using heuristics. Don’t judge a book by its cover. Don’t make snap judgements. Don’t stereotype. Don’t jump to conclusions.
In other words, don’t use heuristics, but rather System 2: evaluate each case individually and analytically. Paradoxically, this is also clearly for good reason. We don’t want to treat every situation or person we run into as simply “another example of X” - every situation or person is unique and should be treated accordingly.
How do we reconcile these views? To answer that, I will draw heavily on statistics.
distributions #
Here is a frequency distribution.
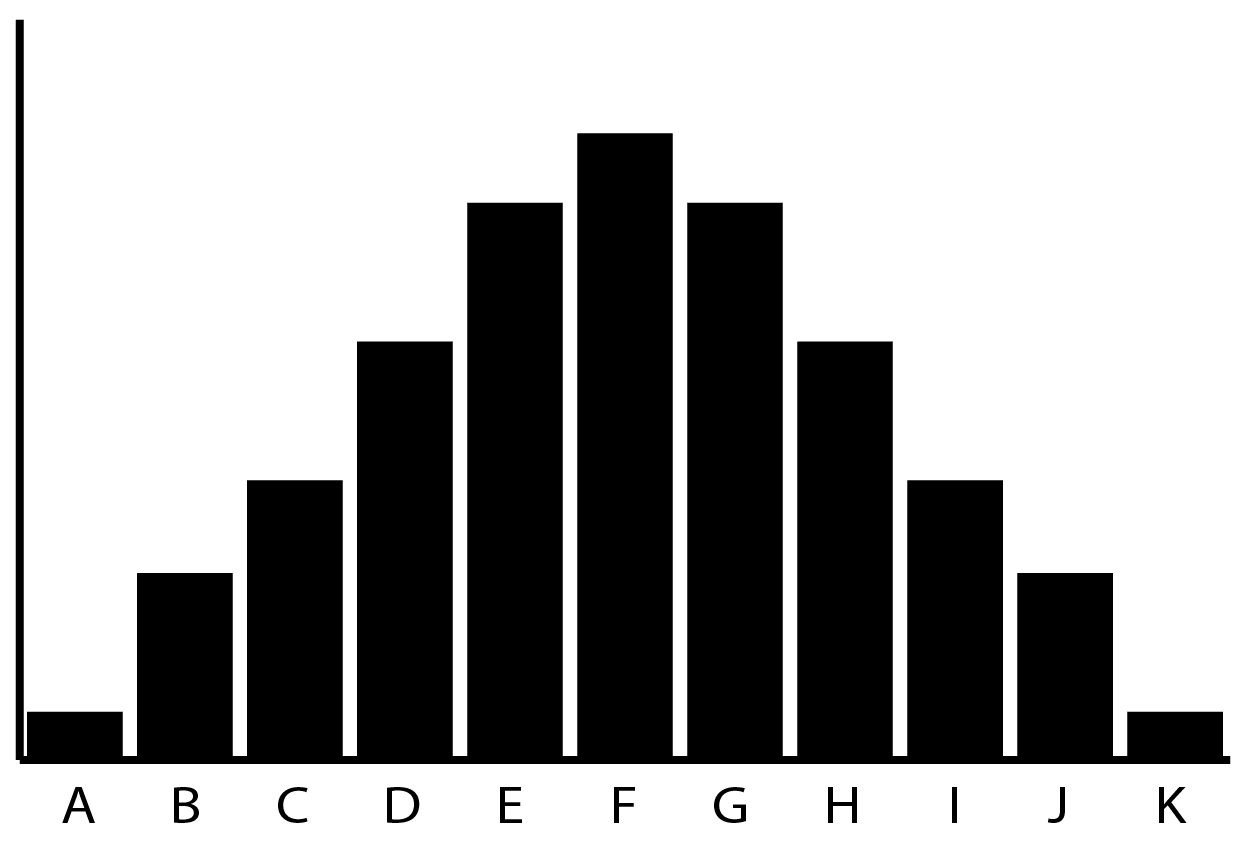
I always think of distributions as easier to understand as “frequency distributions” before mentally converting them into probability distributions. In other words, how frequently do we see something fall into each bin?
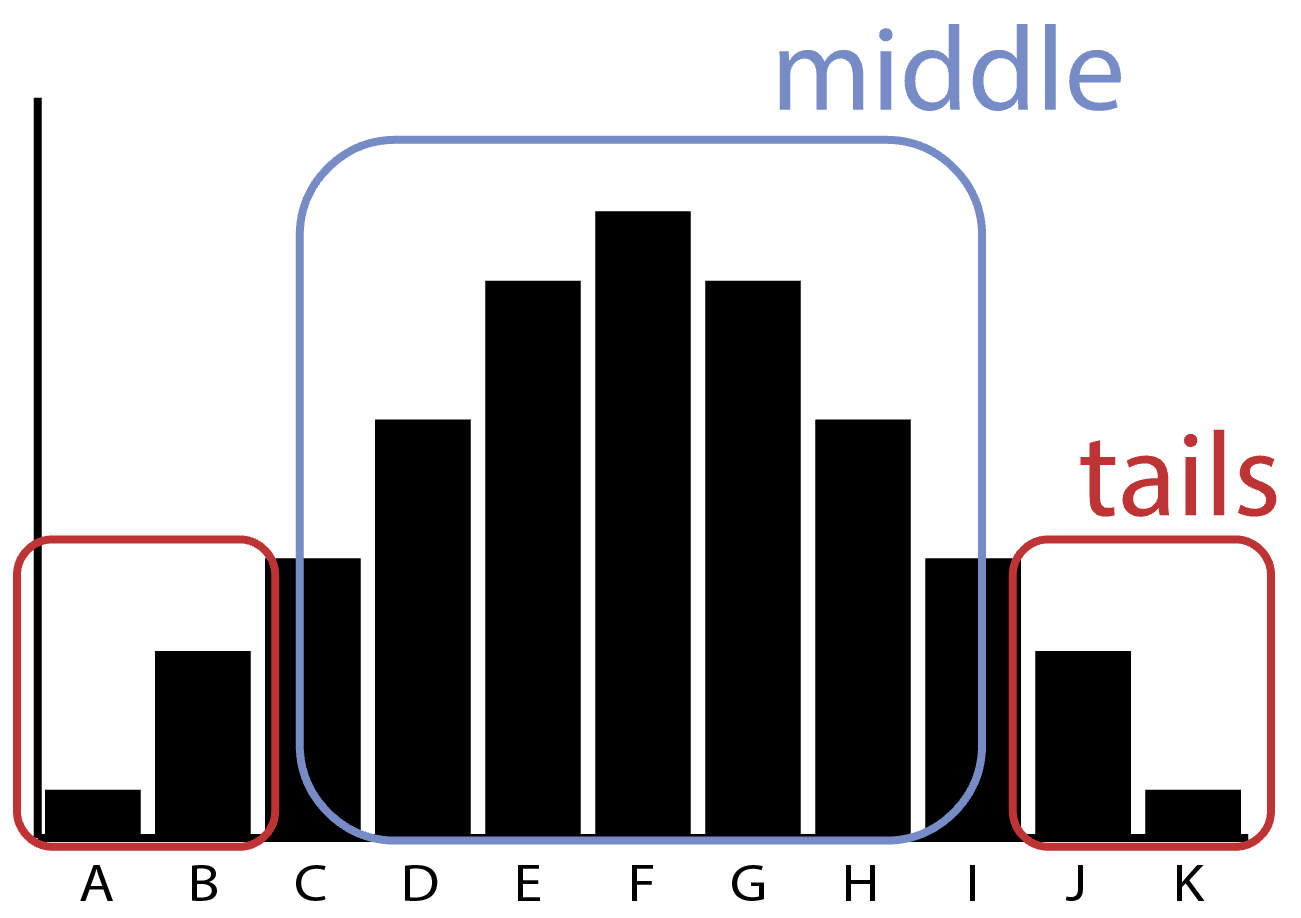
In this distribution, you can see that events in the “tails” occur fairly infrequently while events in the “middle” occur quite frequently:
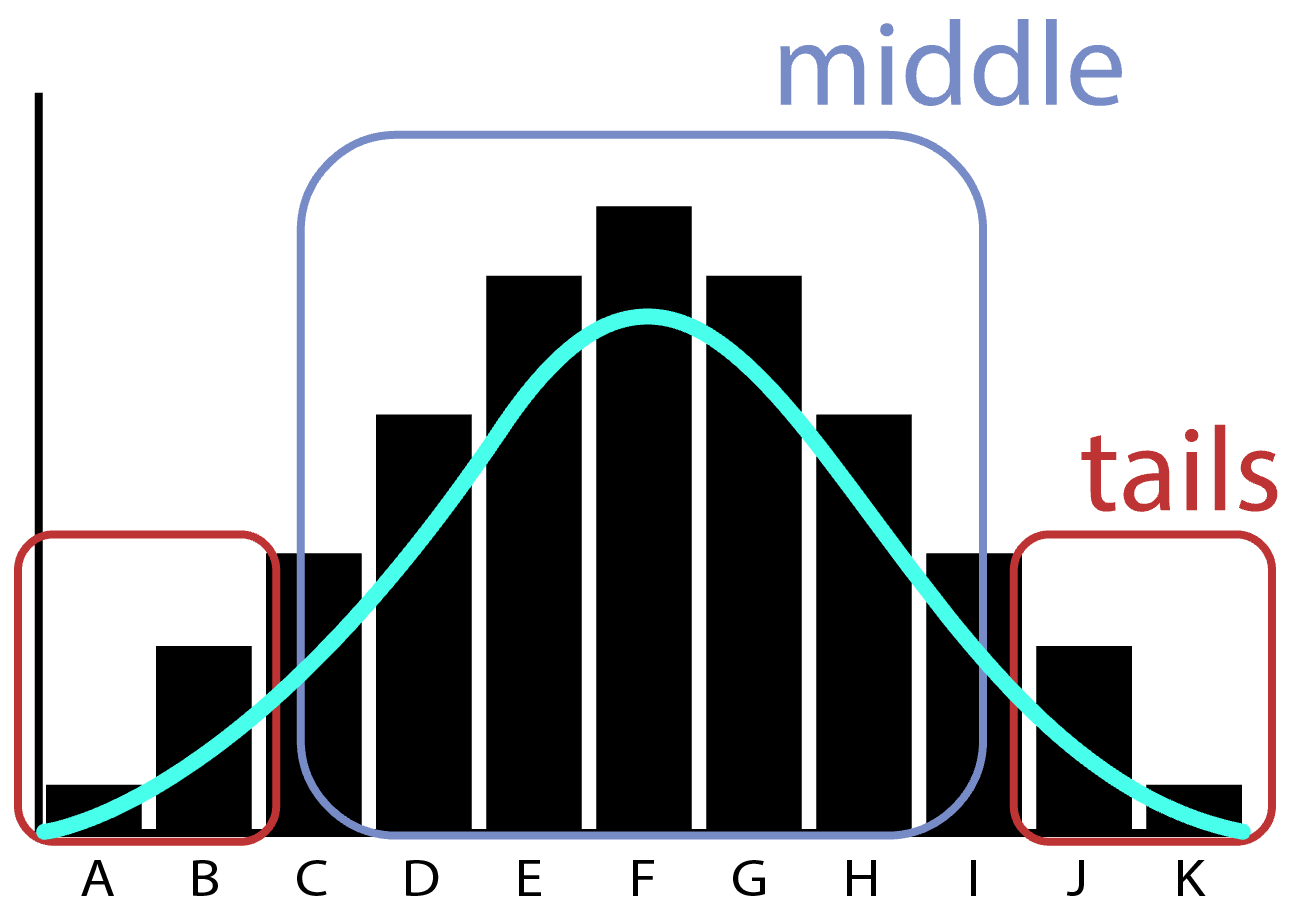
A probability distribution simply sticks a smooth (density) curve over these buckets and says: this is the probability we’d roughly expect to see each of these events in the future, based on the frequency we saw them in the past:
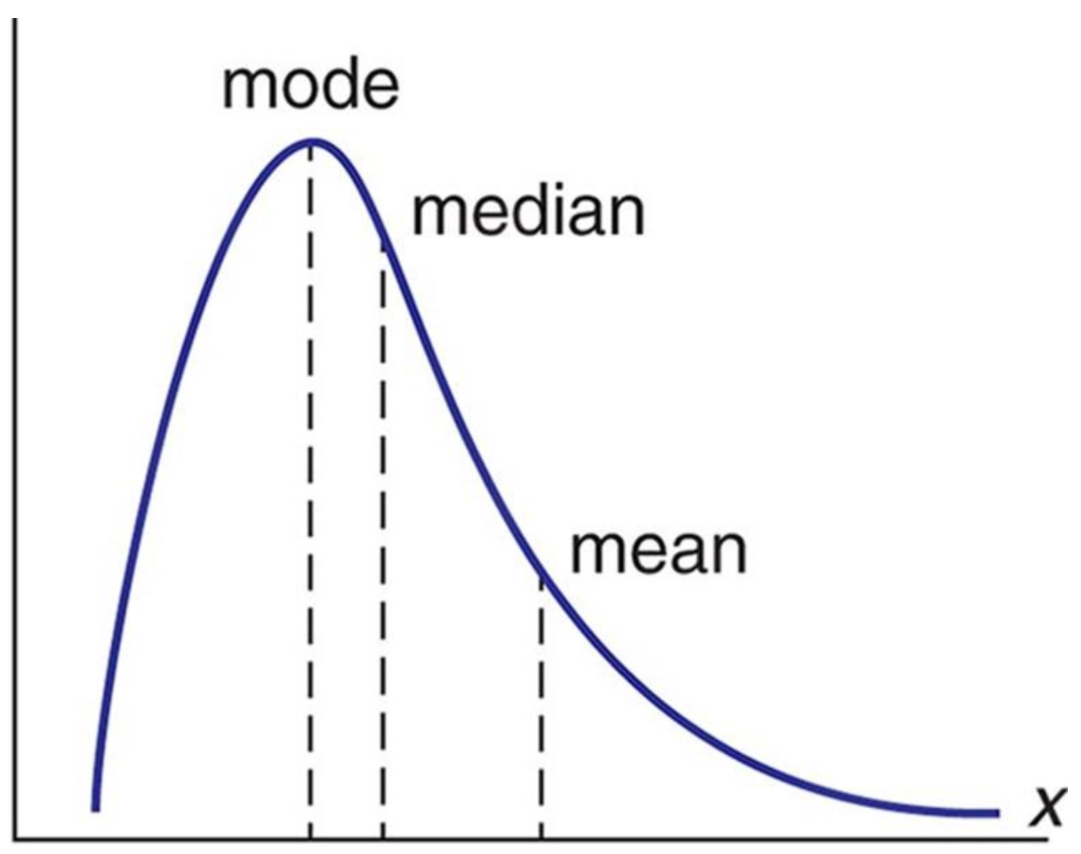
However, we don’t often speak in terms of distributions; instead, we summarize them in the form of statistics. For example, we often refer to a distribution by its average - that is, some measure of central tendency. This is commonly the arithmetic mean, but could also be the median or mode.
In a right-tailed distribution (such as wealth in the United States), we can see where each of these averages fall.
And in a left-tailed distribution (such as life expectancy):
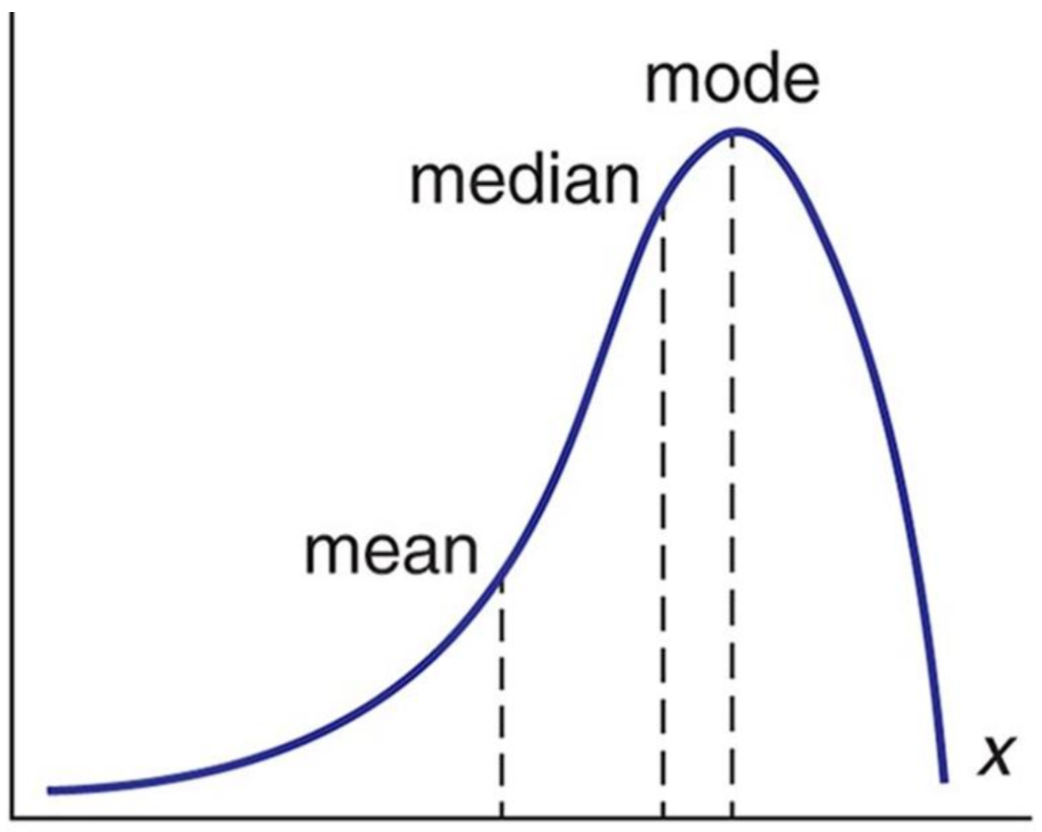
Here’s an important implication of the average: everytime someone is referring to what happens or applies “in most cases”, they are implicitly referring to the middle of the distribution. They are talking about what happens most frequently - the mode of the distribution.
But notice that this does not encompass all of the events! It necessarily excludes the tails.
Let’s take some examples of this using “standard” advice - advice which applies to the average. Most people (i.e. “the average person”) should go to college. Most people should exercise daily. Most people should get a desk job.
This is good and true advice that most people should follow. And yet, there are some people who should definitely not follow these! Some people are better off skipping college entirely; some people have health concerns where daily exercise may be dangerous; and some people don’t have a temperament suited for a typical 9-to-5.
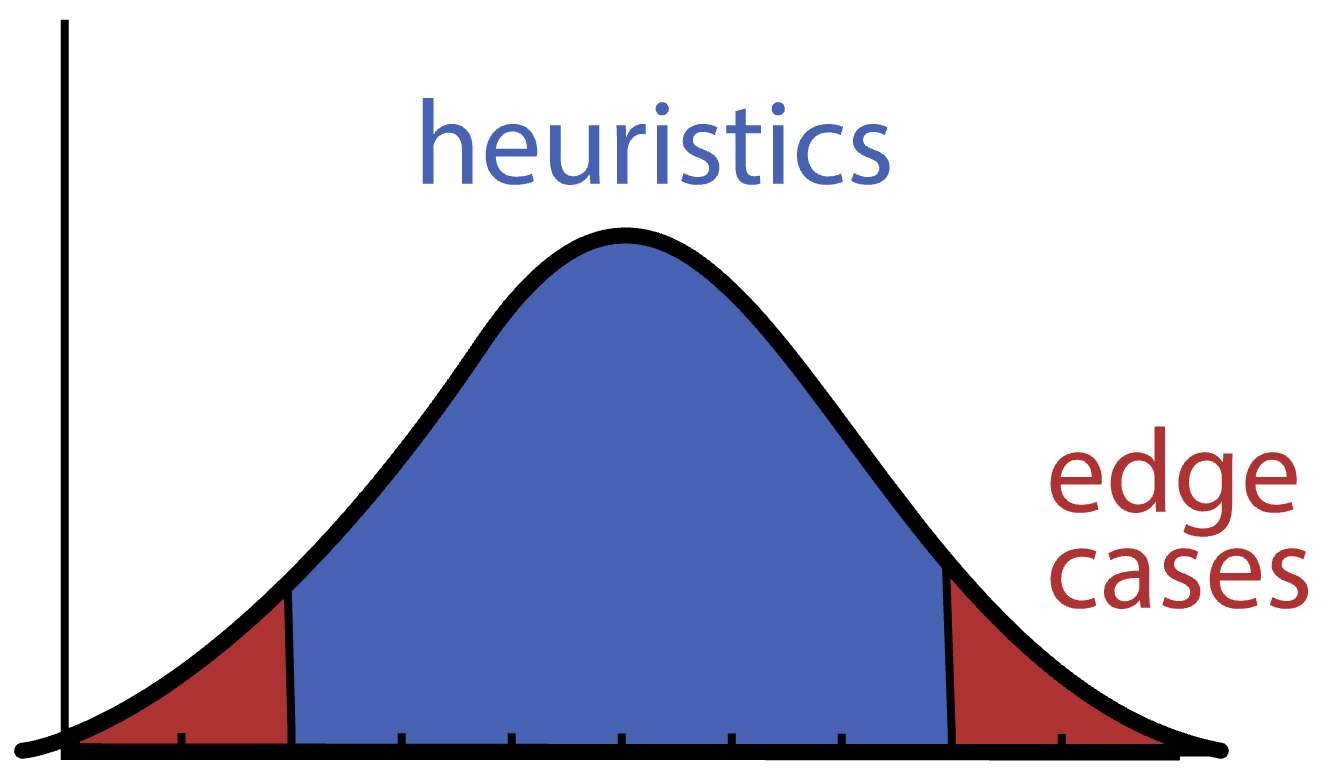
“Standard” advice applies to the “standard” case - that is, what is “average” or “normal” - but not to the edge cases. [1]. Heuristics don’t apply to the tails.
rules are meant to be broken #
Despite this, society, organizations and individuals are constantly applying heuristics to the tails at their own peril. These often come in the form of rules, standards and processes.
For example, we may have a policy that says: in order to promote excellent customer service, we must always give refunds to the clients. And for most clients, this is a fine policy. But for certain tail clients, namely those who identify and then exploit this system, this is a terrible policy.
Similarly, we may have a process that treats all students equally, independent of ability. However, for some students, namely those who are especially gifted or relatively slow, applying the “standard” curriculum is a terrible idea.
As a final example, we may have a rule that compensates employees based on their years of experience, because years of experience correlates with professional ability. And despite this true, empirical correlation, there will always be employees who underperform and overperform relative to their years of experience. Rigidly adhering to the rule, instead of adapting to edge cases, means we keep too many underperformers and lose too many overperformers.
It would seem then that “rules are meant to be broken.”
But is that really true? Not necessarily: we should follow rules when we are in the middle of the distribution, but break them when we are in the tails.
of decisions and distributions #
If situations can be modeled as distributions, then our decisions critically hinge on knowing two things about a distribution:
- Its shape; and
- Where this situation falls on that distribution
If we (1) don’t get the distribution right, we have no sense of how frequently events occur, and by extension, how probable they are to occur in the future.
But even if we do get the distribution right, we need to (2) determine where this event, person, or quality (collectively “observation”) falls along the distribution. Otherwise we will be applying aggregate evidence to an individual case, ignoring all the direct evidence right in front of us.
Even spending 5 minutes reflecting on these two factors can markedly improve our decision-making. I’ll examine each individually.
the shape of the distribution #
Before we can assess where we are on the distribution, we have to first estimate what the distribution looks like. We can’t take for granted that it is normally distributed because many, many things in life are not normally distributed[2].
The shape of the distribution has three important elements:
- The probability density function (ie. its general shape)
- The function’s parameters (i.e. the extent to which that shape is moderated or exaggerated)
- The sample size (i.e. to what extent the realized distribution approximates the theoretical one)
[1] The probability density function defines the general shape of the curve, as can be seen here:

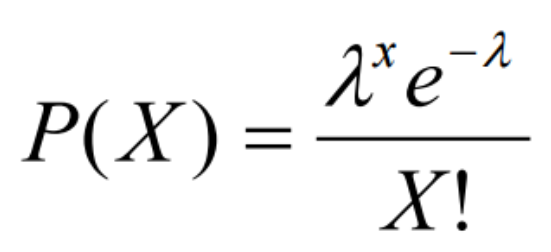
Each of those is associated with a mathematical formula (or class of formulas); for example, the function for the Poisson distribution is:
Clearly, having a sense of the distribution’s general shape can inform us on how probable any event is.
[2] The second property is the function’s parameters, or the values that the function takes as “input” into its shape. Below we can see how this same normal distribution (i.e. the general shape) can change as a function different input values.
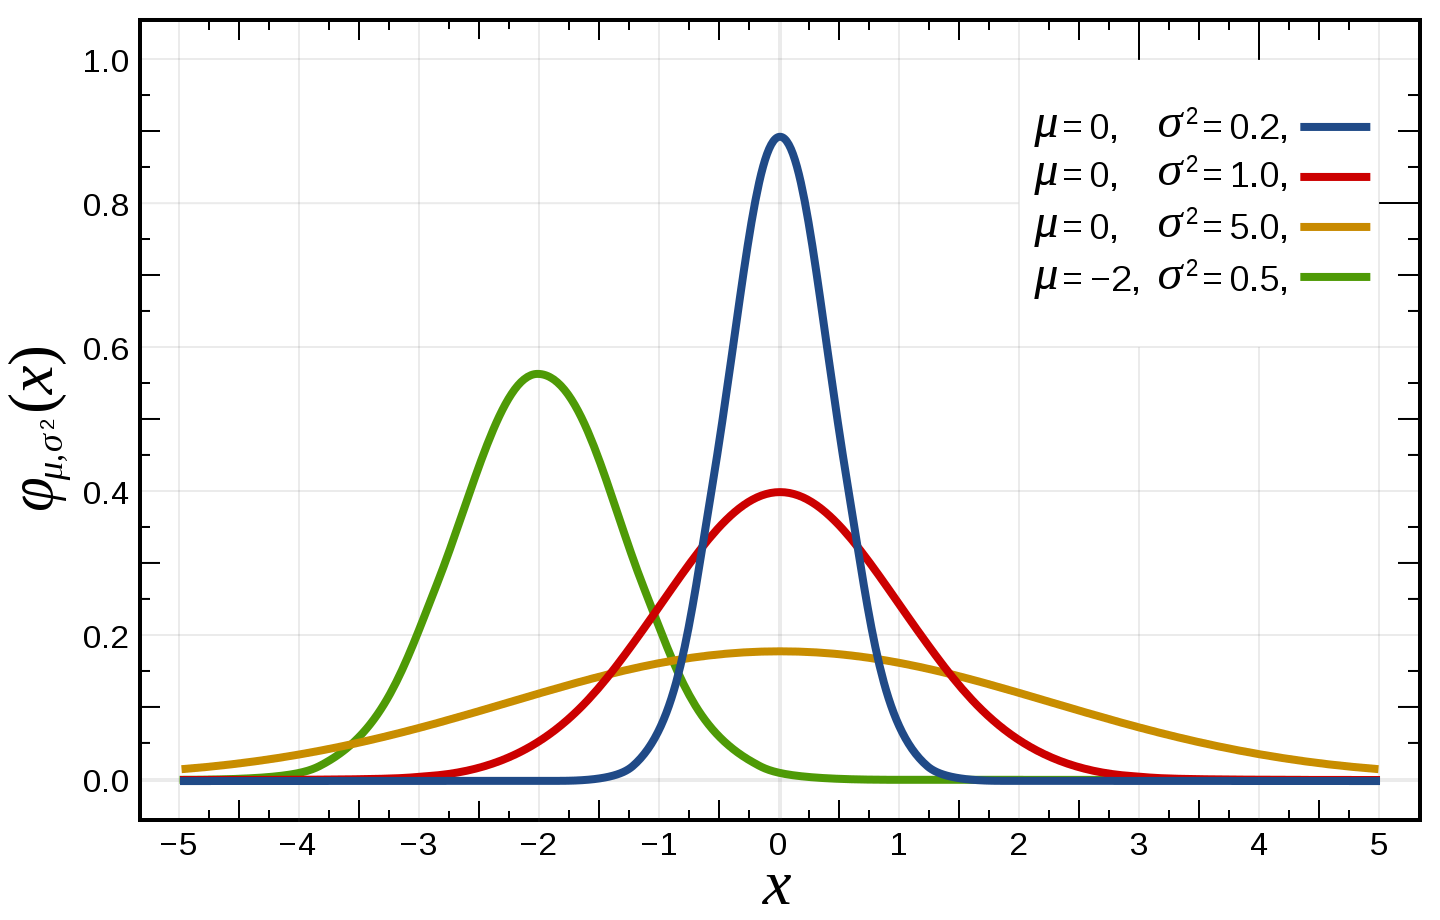
I don’t think it’s particularly important to know about which parameters affect which probability density functions, but I do think it’s important to know that a general shape can be more or less exaggerated depending on its parameters. They can significantly affect not only its average (ie. mean, median or mode), but also higher-level moments such as variance, skewness and kurtosis.
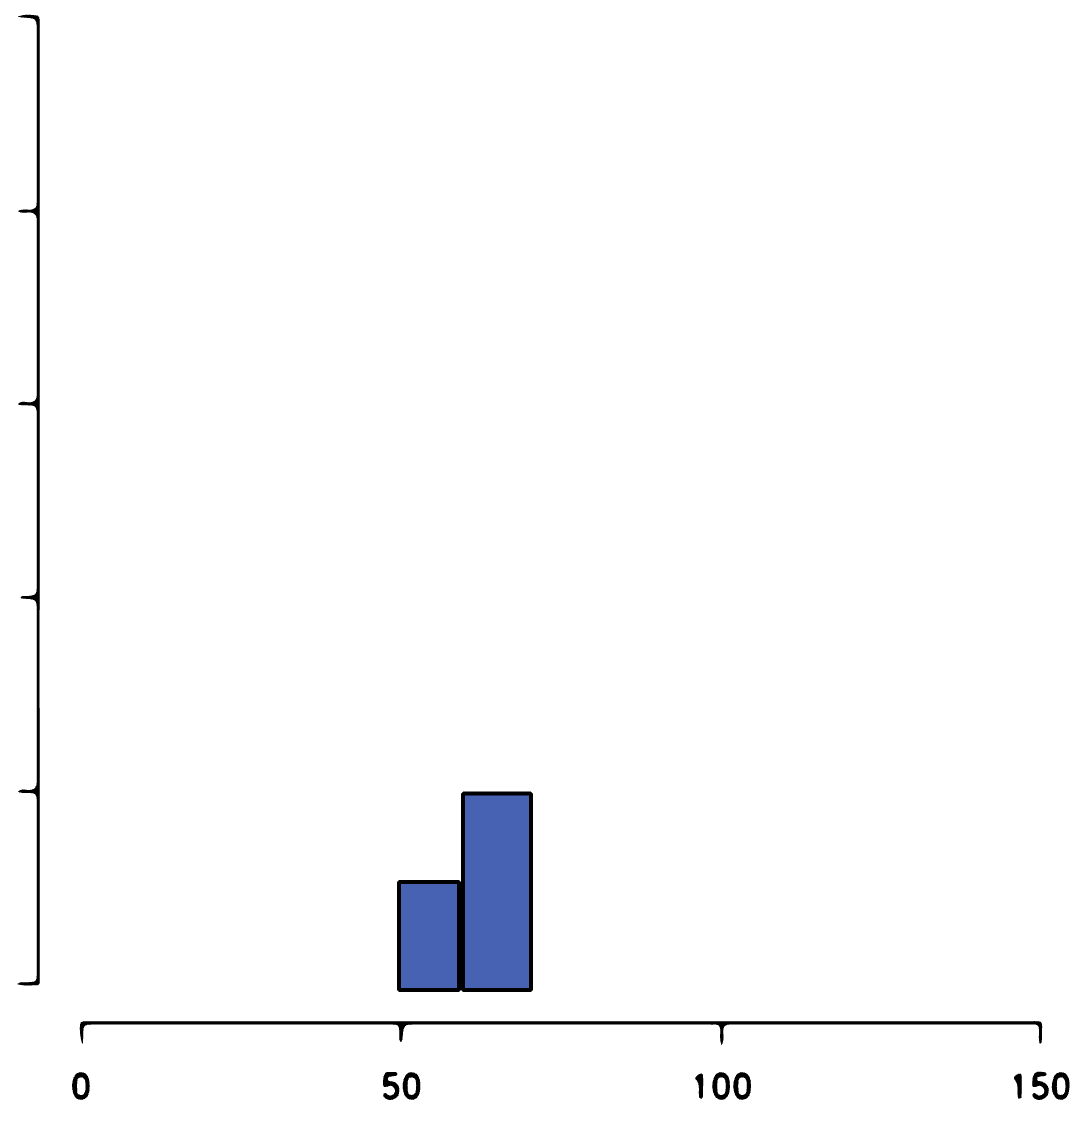
[3] The third property is the sample size. If we have too few observations, we may only be seeing a “glimpse” of the true, underlying population distribution.
For example, we may have a small sample that falls into these buckets:
But only after collecting more samples do we see the distribution looks more like this:
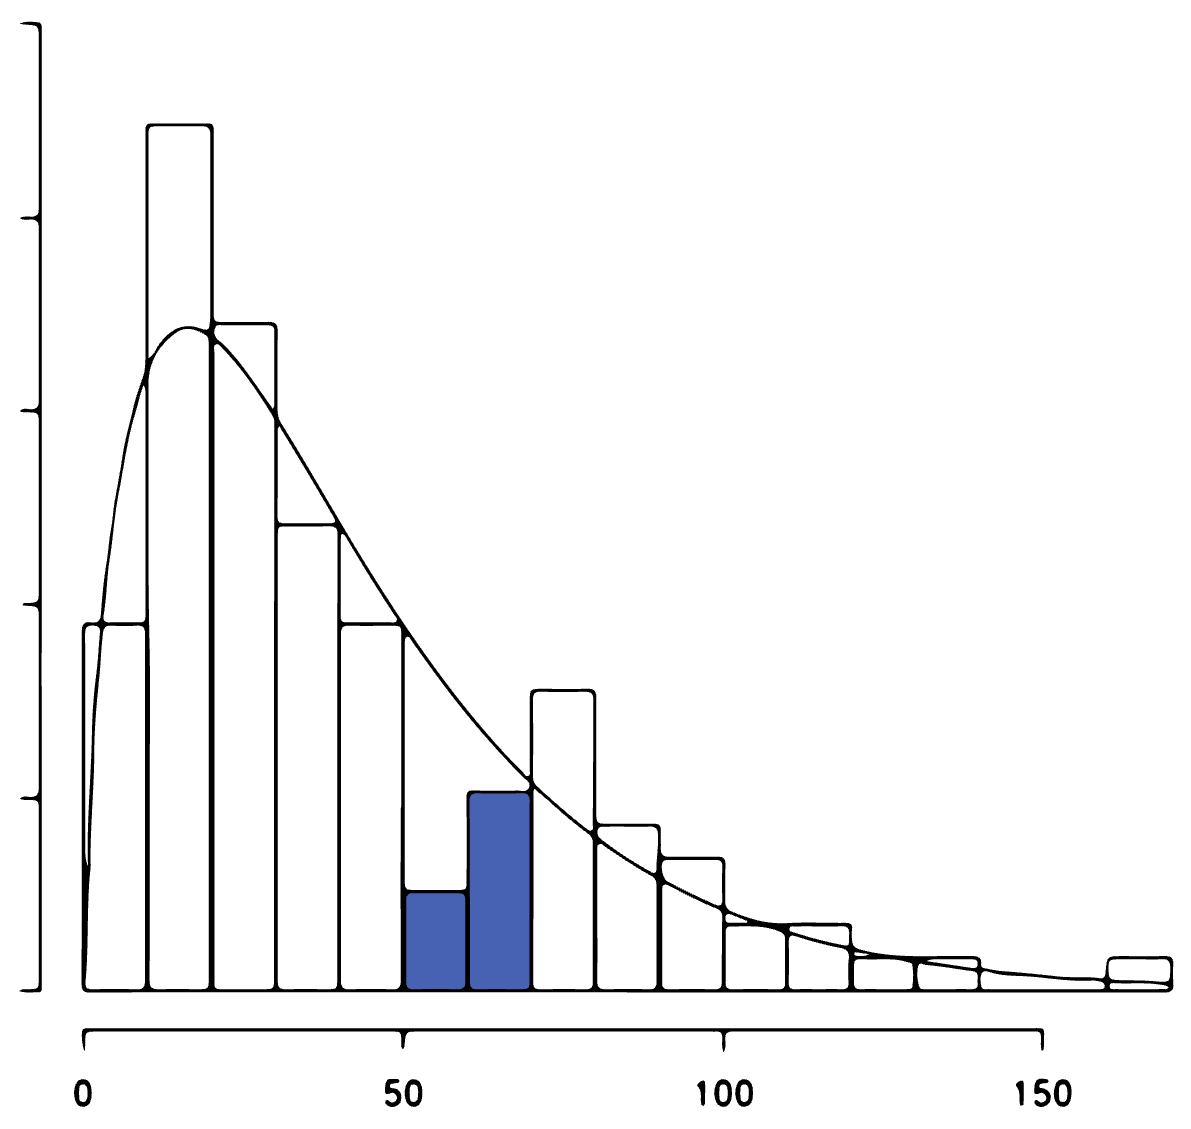
Therefore our sample size reflects our uncertainty about the shape of the distribution: the more observations we collect, the better we can approximate the theoretical distribution[3].
OK, that covers the shape - now to figure out where any given situation falls along it.
the distribution and you #
Once we’ve estimated the distribution, we can consider where any particular event falls along it. This could be a job applicant, a personal characteristic, a first impression and so on.
For example, let’s say that on the commute to work, the bus arrives every day at roughly 9:00am. A good heuristic would be to arrive a few minutes before 9:00am every day.
Today, the bus arrived at 9:30am - a tail event. Clearly our heuristic does not work here because it was designed for the middle of the distribution. We would need a different procedure to identify and react to tail events, such as receiving mobile notifications when the bus is running late.
Conversely, let’s say that upon being diagnosed with abdominal mesothelioma, a rule of thumb (based on historical averages) is that you have 8 months to live.
Of course, that 8-month average depends on where you are on the distribution: do you occupy the middle or the tail?
In fact, this is what Stephen Jay Gould wondered when he himself was diagnosed with mesothelioma, which he described in “The median isn’t the message.” It turns out he was in the tail and ended up living another 20 years.
wrapping up #
I introduced this essay with a fundamental question: when do rely on heuristics, and when do we not? When is System 1 preferable to System 2, and vice versa?
First, we must try and get a sense of the underlying distribution: its shape, its convexity or concavity (a function of the parameters), and its stability (a function of the sample size).
Once we have established the distribution, we can evaluate any individual event: where does it fall on this distribution?
If it’s in the middle, we should be using System 1: procedures, heuristics, standards and rules all apply here. But if it’s a tail event, we should eschew System 1 - this is where heuristics break down.
Heuristics do not apply to the tails - instead, we must evaluate each tail case thoroughly and individually.
[1] Here we can see where proverbs, maxims and adages break down: their inherent generality and broad applicability necessarily means that they do not apply to the tails.
[2] The reason we always think in normal distributions is because we are generally talking about performing statistical tests on the sample means of a sampling distribution. But the underlying population distributions need not be (and are often not) normally distributed.
[3] In a later essay, I will write about how we can and should use Bayesian updating to inform our knowledge of any prior distribution.