Google's OpenRefine works great with messy, survey-like data - and that's it
I stumbled upon OpenRefine over half a year ago while researching tools that should be part of every data scientist’s toolkit. Originally developed at Google, OpenRefine is designed to transform messy datasets into organized, clean ones.
After several weeks of using the software, I feel the software’s raison d’etre must be emphasized. OpenRefine is designed for messy data. Said differently, if you have clean data that simply needs to be reorganized, you’re better off using Microsoft Excel, R, SAS, Python pandas or virtually any other database software.
First of all, what is “clean” data?
Clean datasets require very few (often one) transformations per column. For example, say you have a table of employees that includes a ‘date_of_birth’ column. You may need to convert this ‘date_of_birth’ string into a datetime type. To do this, you apply one operation (a datetime function) to the entire column. Or, let’s say you have an ID column whose values are in the string form ‘employee_id_1212459’ - split the string by underscores and take the last element. Even simple data replacement is still in the realm of a clean dataset: replace all values encoded as ‘999’ (ie. a filtered subset) with type Null. All of these clean datasets share one commonality: relatively few operations and subsets are required to reorganize the data. Most can be transformed using a few lines of code.
Messy data, by contrast, is when dozens of operations and subsets are required to reorganize the data. For example, consider a visitor who each day signs his name in the guest log slightly differently: “john smith”, “J Smith”, “John Smifh”, “Jon Smith”. Several operations are needed to transform this column – perhaps even a transformation for each entry. As the programming rules become more and more ad hoc, the messier the dataset is.
In fact, what differentiates clean data from messy data is not organizational structure but data consistency. While clean datasets may not be organized as you’d like (eg. datetimes are stored as strings), they are at least consistent. Messy datasets, on the other hand, are defined by inconsistency: typos abound and there is no standardization on how the data should be input. You will only ever find messy datasets, practically by definition, when humans input the data themselves.
In today’s age of data abundance, the vast majority of data is not produced by human entry. Though sometimes carelessly organized, the data is clean. This is not where OpenRefine excels. Why?
Because while OpenRefine can work with clean data, so can a whole host of other software. Need to replace all values greater than n? Filter by value and drag down your replacement value in Excel. Need to group together similar names? Remove duplicates and sort, then manually edit the group names together and VLOOKUP old names to new group names (ie. a crosswalk). Have a complicated regular expression you need to implement? It’s probably easier to use a programming language of your choice than try to learn the Google Refine Expression Language (GREL).
Not only can these software work with clean data, they are often better at it. OpenRefine hiccups over larger datasets and has buggy loading when it comes to nonstandard file formats (like .xlsx). It’s also not a relational database so you can’t (easily) join together multiple tables – everything has to be on one giant table. If you’re already proficient in Excel, there’s an Excel formula for virtually everything you’d find in the GREL (except a few convenience functions like .reverse()). Any advanced functionality in OpenRefine requires learning the GREL, at which point you’re better off using a more widely-used programming language.
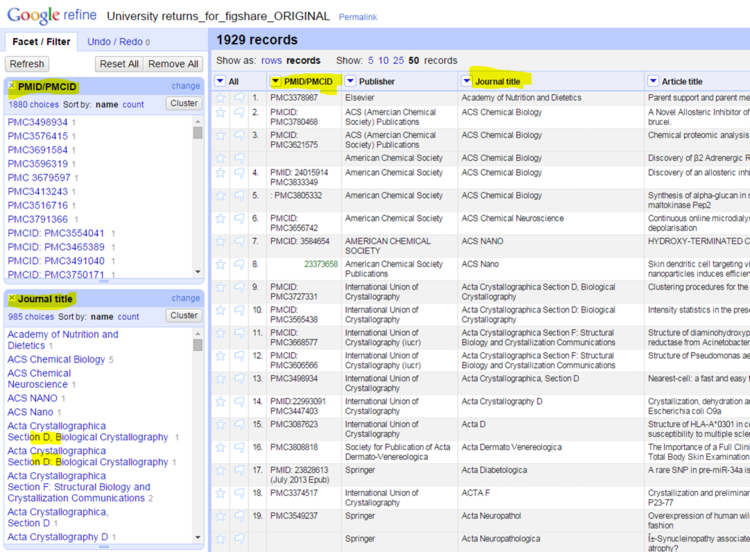
Ok, so we’ve determined that OpenRefine really doesn’t add much when it comes to clean data, which brings us back to the original point: OpenRefine is meant for messy data. Here, in its limited applicability, OpenRefine really shines. Clustering can save a lot of manual work for grouping together inconsistently typed strings (even, for example, identifying “John Smith” and “Smith, John” as a group, which can be difficult to keep track of when going through a sorted list by hand). Additionally, OpenRefine displays an easy-to-access histogram (via its numeric facet) for columns housing inconsistent data types. In one view, it shows you numeric outliers, as well as counts of strings and blanks in the column. Of course, this can all be done in Excel or a programming language, but not as conveniently.
All in all, OpenRefine does one thing really well: traverse messy data. If you’re not sure that you’re dealing with messy data (hint: you probably aren’t), OpenRefine can quickly show you the breakdown of each of your columns. Especially when it comes to similar strings, OpenRefine can help enormously in clustering these. Beyond that, however, you’re better off sticking with your more familiar tools in lieu of learning a new one.